Map of Data Centers
The above map shows data centers and crypto mines.
The black icons represent completed data centers, and the orange data centers in progress. A number over the icon represents more than one data center; these will ‘separate out’ as you zoom in on the map using the “+” symbol in the bottom right.
The yellow triangles represent known Crypto Mines – which are not Data Centers – but still energy and water superconsumers.
When you press these icons, a pop up appears with basic information: the data center name, address, county, energy source, absolute location (latitude & latitude), and owner. There is also more detailed information: data center power usage, total power, total square feet, water source, and water usage in gallons. Much of the detailed information is only estimated due to lack of public information about exact values. For example, the power usage is based on the square feet of the given data center, and the water usage is based on power usage. Blanks in the pop ups indicate a lack of enough information to even estimate values. (The trouble with data center energy figures – DCD ).
If you would like to interact with the map – click here or press the expand icon on the map – you can also add and hide layers.
The state of GA has the attention of the tech industry for new development of data centers and crypto mines. The perception of ample energy supply in addition to enticing local tax incentives make GA a target for expansion of this industry, but what does this mean for Georgians?
The locations of these data centers matter to Georgians for several reasons. Resource depletion, noise pollution, and loss of agricultural land to massive structures that cannot be repurposed easily are some examples. Additionally, these data centers do not manufacture anything, do not create enough jobs per acre to make an impact on local economies, and rely on a high risk supply side ai market that carries higher rates of bankruptcy than traditional industries. Recently, a study in Journal of Hospitality Marketing & Management showed that products or companies that used ai in their products deterred consumer interest due to lack of trust in quality and reliability in AI.
Georgia is represented at the federal level by two Senate seats and fourteen US House seats. The map to the left shows the US House boundaries and the locations of data centers and crypto mines.
The Federal Data Center Enhancement Act of 2023 was introduced by Senator Jacky Rosen (D-NV) of the 118th congress to address new data center development and would establish some basic regulations for government agency data centers, but there has not been a vote.
Additionally, Unleashing Low-Cost Rural AI Act was introduced in September 2025 and “would require the federal government to study the impact of artificial intelligence and data centers on rural America’s energy supply and cost to consumers.” This legislation was introduced by Reps. Blake Moore (R-Utah) and Jim Costa (D-California). On September 9th 2025, it was Referred to the House Committee on Science, Space, and Technology.
The Georgia State Senate has 56 seats – which are shown in darker purple on the map. Currently, the State Senate has introduced SB 34 which is a bill that requires the Public Service Commission to prevent energy ratepayers from incurring increased rates from costs that result from supplying data centers with energy.
This layer shows the 180 seats of the GA House in purple. Each of these elected officials serves 2-year terms.
Data centers have little state regulation concerning community resources, unlike other industries, and rely on local community commissioners to decide facility restrictions. For example, Georgia’s farmers are regulated by the state to measure their water use to ensure supply for residential and commercial customers throughout their entire watershed. Because data centers use more water than a traditional light manufacturer, one district could increase demand for a resource that impacts another district becoming a state issue. Increases in energy use may increase the power bill rates in a region or the entire state.
In the GA State House, HB 528 and HB 559 were introduced in the house regarding data centers. HB 528 aims to create transparency in resource use and community impact while HB 559 amends Code Section 48-8-3 revising the current tax exemptions to expire in 2026 instead of 2031.
The yellow boundaries show rural areas. Rural areas may be eligible for the 2023 Broadband Equity Access and Deployment (BEAD) a federal grant program under the Infrastructure Investment and Jobs Act (IIJA) offering funds to improve fiber access. Rural areas would benefit from fiber installation because it improves access to e-commerce, remote jobs, online school opportunities, and telehealth which build community resilience. Generally, private fiber providers do not invest in this infrastructure in rural towns due to low return on investment, and the BEAD program provides federal funding to bridge the gap in accessibility.

In this layer, blue reflects customers who could be connected to any broadband, otherwise known as a Broadband Serviceable Location (BLS). BLS could mean an option to hook up either fiber, cable, wireless, or copper connections. The darker the blue, the more broadband customers there are.
The red in the map shows the broadband customers, or serviceable locations, that don’t have access to fiber – so the darker red means fiber is either not installed for customer locations, or they have broadband that is above ground and may be slower than costumers prefer.
Georgia broadband has three classifications based on speed: very low speeds (unserved), low speeds (underserved) and high speeds (served).
When the two colors overlap, the color becomes maroon, and the darkest maroon means a large population doesn’t have fiber and there is a market for fiber installation.
The US are shown in this layer. Interstate lines (through more than one state) are the burnt orange lines, while intrastate lines (within one state) are the mustard yellow lines. We are able to easily see that the majority of current and planned data centers are located close to gas infrastructure that all Southern Company ratepayers are charged for. Georgia Power, a subsidiary of Southern Company, recently announced that the expansion of natural gas is part of the answer to hypothetical data center development projected to need 9,900 megawatts, nearly double the current energy use in the state. Increasing gas energy will increase pollution and further hinder investment in renewables in the state.
The proposed expansion of natural gas is called the South System Expansion 4 or SSE4. The bright red lines across the center of the state are the proposed pipeline expansion locations. The black lines along that same route show the pipeline that is already in the ground and operating. Access to this increased energy supply and federal tax breaks could draw data centers to areas currently zoned for agriculture.

This layer shows areas that have been identified for priority water conservation as part of the Source Water Protection Program provisions of the 2018 Farm Bill. The light pink areas indicate areas where water quantity conservation have been reported as a priority. The purple areas indicate where water quality conservation is a priority. Red areas show where both quantity and quality are equally a priority. This designation was reached after local government and citizens filed with the federal government and were approved based on qualifications laid out in the program.
Data centers use water for cooling their energy intensive machines. A 2021 paper estimated “Nationally, we estimate that 1 MWh of energy consumption by a data center requires 7.1 m3 of water” (Siddik et al). While this depends on the type of cooling system used by the facility, data centers use of water also depends on the type of energy it utilizes to understand the total water use.
Hyperscale data centers, the largest type of these facilities, use anywhere from 10 MWh to 100 MWh of power. Currently, Dekalb county is considering the request for a 1 million square foot data center and many are asking if it makes sense for the community.
Water is a nonrenewable resource, and GA is a state with a deep history of water issues. To prevent water access disruption and build resilience in GA, it is important to regulate water us, including by data centers, with a clear understanding of prioritizing long-term resilience.

This layer illustrates the data collected by the EPA from the USDS and state institutions reflecting 2010 industrial water use in millions of gallons per day. Yellow areas as the areas of least industrial use, changing to green as water use increases, and dark blue reflecting high usage. This data has been used to forecast water use and help states and counties understand demand. The Georgia Water Planning Department releases a water use forecast using this data as illustrated in the above chart. Data center water demand should be calculated in the Industrial Water Use forecast by the Georgia Water Planning Department but the report from 2022 is the most current forecast and can’t include the industry’s projected water use because we don’t have a clear projection of the data centers coming to the state. Additionally, previous industrial water use forecasts have relied on state GDP and job numbers to calculate industrial water use, but data centers do not neatly fit into that formula and, along with automation of jobs and changes in production technologies, create a challenge for county and state planning. The Georgia Water Planning Department notes in that 2022 report that “EPD should re-evaluate industrial water demand in Georgia every 5 to 10 years to adjust for changing conditions.” With the change in industrial water use from traditional manufacturing to data centers, a new report would be beneficial to understand industrial water use in the state.

According to the EPA “A persistent period of unusually hot days is referred to as an extreme heat event or a heat wave.” A heat wave can result in crop loss, medical emergencies for residents and can create a strain on on energy infrastructure.
This map illustrates the frequency of heat waves in GA where the darker red is an area that has more heat waves per year. As illustrated in the data above, the EPA notes that heatwave “frequency has increased steadily, from an average of two heat waves per year during the 1960s to six per year during the 2010s and 2020s.” In GA, the darkest red areas see over 10 heat waves per year. When heat waves occur, data centers may need to shut down to protect the equipment from overheating. A risk analysis report by Maplecroft based in the UK warns that “By 2030, under SSP5-8.5, 52% of global data centre hubs are categorised as facing ‘high’ or ‘very high’ risk in our Water Stress Index, which evaluates total water use relative to total annual available flow. By 2050, this rises to 58%. Given growing water use requirements due to increasing demand for data centres and rising temperatures, water scarcity is likely to become a double-edged resilience and sustainability risk in companies’ supply chains for IT and cloud-based services.” The analysis reflects the market’s ability to recognize the heat related risks within this industry, suggesting local policy should also consider these risks of the increased burden of a resource intensive industry.
Forbes notes that though data centers are producing jobs, these jobs are temporary with more jobs in manufacturing not occurring at the data center.
Percentages of unemployment are represented in green with darker green illustrating higher percentages of unemployed residents. The map shows data at the county level as well as the tract level.
A UGA audit of the tax credit found “The total of increased state tax collections resulting from construction and operation of data centers is not high enough to offset the forgone state tax revenue from the incentive, thus the fiscal impact is negative. The total fiscal impact of Georgia’s High-Tech Data Center Equipment Exemption ranges from -$5.4 million in 2018 to -$56.7 million in 2030.”
GA relies on state and local taxes for public infrastructure like hospitals, fire stations, schools, and libraries that can be seen in the map to the left. The image above is from an UGA audit of the GA tax credit data centers are offered found “The total of increased state tax collections resulting from construction and operation of data centers is not high enough to offset the forgone state tax revenue from the incentive, thus the fiscal impact is negative. The total fiscal impact of Georgia’s High-Tech Data Center Equipment Exemption ranges from -$5.4 million in 2018 to -$56.7 million in 2030.” In 2024, both the GA House and Senate voted to pause the tax credit, but Governor Kemp vetoed this effort.
Emergency
The map shows 1,789 fire stations or EMS stations with red F’s. Fire stations are doing their best to prepare for emergencies concerning data centers, but these facilities need additional training to understand the risks and dangers of this industry. This requires additional training of fire fighters on staff as well as volunteers, housing the proper fire suppressants and tools for response to an electrical fire. Additionally, the station needs to have enough staff to respond to a fire in a massive building with a complicated layout. Finally, if the data center backs up data on lithium batteries, there is risk of explosion.
Schools
There are 2,314 public schools in Georgia with 1,740,875 enrolled students. According to the GA department of Education “Georgia ranks 1st in the U.S. in connecting the K-12 education system with early learning, higher education, and the world of work, according to Education Week” and “17th in the nation for K-12 achievement.” The ranking of first for connecting early learning to K-12 education is due to the state wide initiative funded by GA. taxes.
Libraries
There are 408 library locations in GA offering digital access, classes and meeting space for building community connections, and community support for all walks of life. Much of the funding for libraries comes from county budgets, but most also rely on state funds to operate. A study conducted by the UGA Carl Vinson Institute of Government funded by the library found that GA libraries provide $562.1 million in social benefits and generate $170.7 million annually in economic impacts to the state. Federal cuts to the Institute of Museum and Library Services (IMLS) may impact this infrastructure requiring more support from the state to keep necessary programs operating.
 Hospitals are noted in the map as different colored triangles. The critical access hospitals are noted in red and deal with trauma and emergency medical events where every second counts while the acute care in blue handle general emergency medical care. Orange triangles are children’s hospitals, while the yellow and purple deal with military and veterans care. Green indicates hospitals that focus on psychiatric care.
There were 109 hospitals in GA as of May 2024, but with previous closures like that of Atlanta Medical Center, hospitals are often strained in resources to provide care. Health outcomes become worse at times of weather events like heat waves and ice storms in a strained health care system. GA is currently within the 5 worst states in the US for healthcare. Researchers at have UC Riverside, Caltech and RIT calculated that data centers are “projected to push the total annual public health burden of U.S. data centers up to more than $20 billion in 2028”
Rural hospitals in GA are closing or reducing the types of care offered. For instance, St. Mary’s Sacred Heart Hospital in Lavonia, GA will be closing their OB/GYN services and moving them to their Athens hospital about an hour south. It has been reported that twenty rural hospitals across GA are at risk of closing.
Energy Infrastructure
- Natural Gas Pipelines — US EIA Living Atlas
- Power Plants (100MW+) — Canada Open Data
- SSE4 Route — FracTracker Alliance
Environmental Planning
- DCA Environmental Planning — DCAGIS
- Source Water Protection High Priority Areas — Natural Resource Conservation Service (NRCS)
- Industrial Water Use — EPA EnviroAtlas
- Watersheds (HUC-8) — Georgia Planning
- Flood Hazard Areas — FEMA
- NRI Census Tracts — FEMA
- North American Environmental Atlas — CEC
Community + Economic
- Less Developed Census Tracts — GA DCA
- Opportunity Zones — HUD
- ACS (American Community Survey) — ARC Open Data
Public Services
Utilities + Broadband
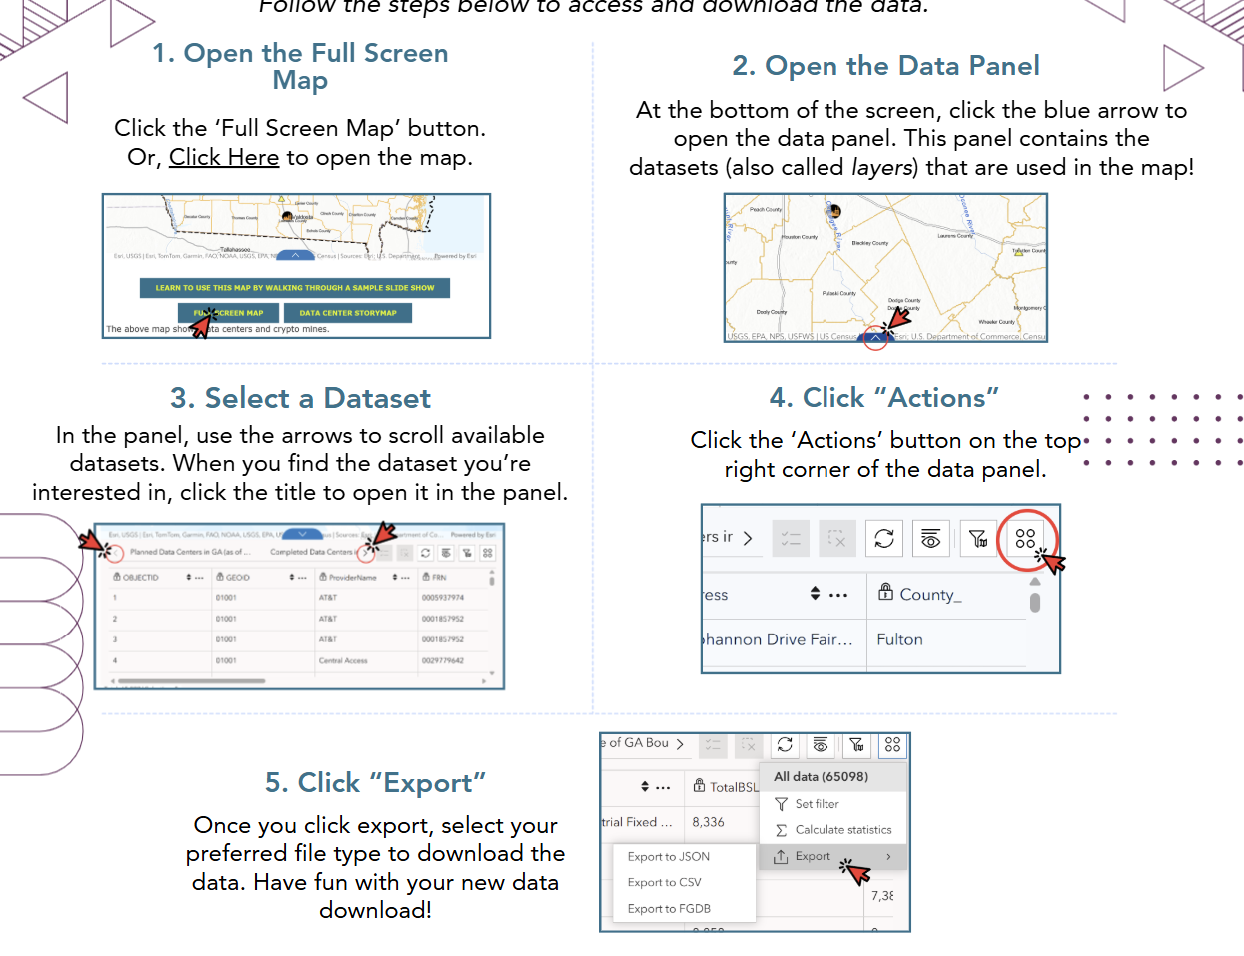
- Click the ‘Full Screen Map’ button. Or, Click Here to open the map.
- At the bottom of the screen, click the blue arrow to open the data panel. This panel contains the datasets (also called layers) that are used in the map!
- In the panel, use the arrows to scroll available datasets. When you find the dataset you’re interested in, click the title to open it in the panel.
- Click the ‘Actions’ button on the top right corner of the data panel.
- Once you click export, select your preferred file type to download the data. Have fun with your new data download!