80%
of Richmond Co’s census tracts have stroke rates higher than the national average.
3rd worst
Richmond Co’s Sci4Ga Burden Score
1-4 years
decreased life expectancy in Richmond Co compared to Georgia
Augusta is a tale of two cities that are separated geographically by environmental burdens, toxic releases, health, income, and race. These issues are rooted in hundreds of years of policy. And they add up to an socio-economic burden. The first tab below shows Sci4Ga’s environmental burden index which accounts for indicators like socio-economic status, exposure to pollution, energy costs, healthcare access, and others. Darker blue indicates a higher burden.
The below maps summarize the big picture of Augusta. Herein, this page highlights work done by interns and Emory QTM students to begin to explore in-depth the issues faced by communities in and around Augusta.
Of note in all of these maps, one of the southwest areas appears to be an anomaly. This is because this region is occupied by the US Military for Fort Eisenhower designated to support the Army, Air Force, Navy, Marines, and Department of Defense in personnel training.
Triangles indicate the “Hazardous Waste Sites” in the Hazardous Site Inventory. Clicking each one includes a link to the EPA for more information.
The blue shades underneath this show the “Environmental Justice Index” created by Science for Georgia in collaboration with the Georgia Water Coalition. The darkest blue regions are the most burdened by compounding harm in the categories: income, climate change, energy, health, housing, legacy pollution, traffic pollution, wastewater, and workforce development. Each of these factors can enhance the harm from the others, making it harder for the communities to lift themselves up, improve their environment, their health and thrive.
Darkest colors in this map indicate locations where the worst health is being experienced by the residents.
This is a colormap of household income by region. The blue/purple color is where income is lower than average with the darkest color shoing the lowest incomes. Green colored regions have income higher than average, with darkest regions having the highest income.
This map displays the majority race in each region, with yellow indicating majority African American and beige indicating majority white areas. For each color, darker shades indicate locations with larger percentage majority of the dominant race. Click back through the other tabs to see how the yellow (majority-black) regions overlap with other environmental, economic, and health factors.
Environmental injustice in Augusta has historical roots, shaped by factors such as racial segregation, industrialization, and urban planning decisions. Throughout the 19th and 20th centuries, Augusta experienced significant industrial growth, particularly in sectors such as textiles, paper manufacturing, and chemical production. These industrial facilities, including manufacturing plants, chemical factories, and other industrial operations release pollutants into the air, water, and soil as part of their operations.
Poor air quality can have adverse effects on public health, exacerbating respiratory conditions and increasing the risk of cardiovascular diseases. Industrial discharges can impact water quality in Augusta, particularly in the Savannah River, which runs along the city’s eastern border.
Contaminants from industrial operations, such as heavy metals, chemicals, and other pollutants, can enter waterways through runoff or direct discharges, posing risks to aquatic ecosystems and potentially affecting drinking water sources. These environmental injustices not only harm public health but also perpetuate cycles of poverty and inequality. They erode community well-being, exacerbate existing social divides, and hinder economic development.
Air Quality and Asthma
The below map shows the overall occurrence of air pollution (darker orange signifies more pollution), point source polluters (darker blue dots indicate higher emissions), and the prevalence of asthma (darker purple indicates higher percentage of asthma).
Air pollution is often measured by the amount of PM2.5 in the air. PM2.5 is a measure of the fine particles suspended in the air, which can penetrate deep into the lungs and exacerbate respiratory conditions such as asthma. High levels of PM2.5 pollution are associated with increased respiratory symptoms, exacerbation of asthma attacks, and decreased lung function, particularly among vulnerable populations.
The map indicates a correlation between the amount of pollution and rate of asthma. Disadvantaged communities facing elevated pollution levels are typically disproportionately impacted by respiratory health disparities.
Life Expectancy
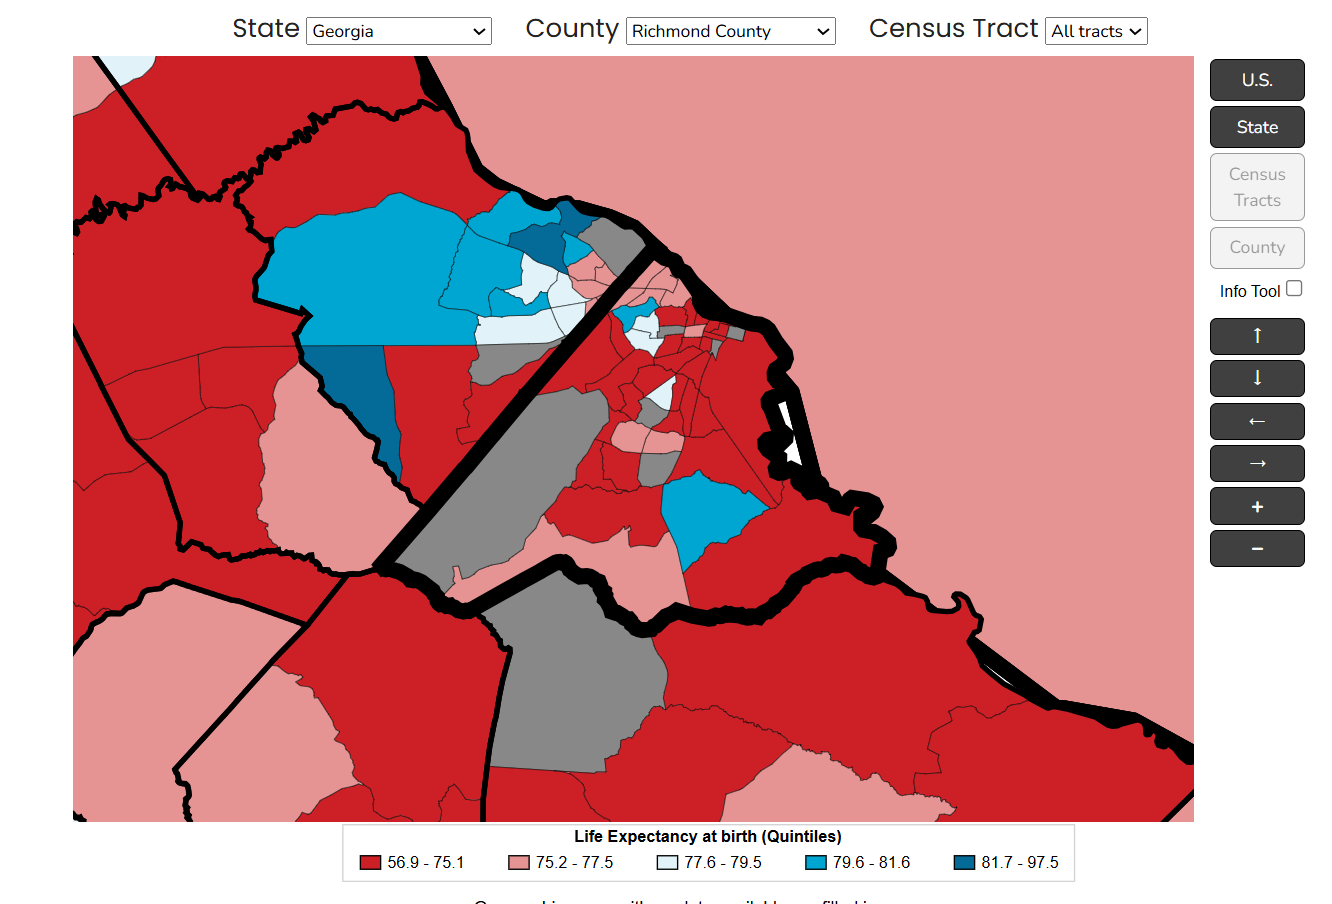
The toll of environmental burdens adds up to a decreased life expectancy. In the Augusta area – the census tracts that have the highest burdens and the lowest incomes also have the lowest life expectancy. On average, citizens in these areas of Augusta live 1-4 years less than an average Georgian. The map below highlights life expectancy by area. The darker the red, the lower the lifetime. This information can be interacted with here: Life Expectancy Data Viz (cdc.gov).

